Mitigating climate change
Eco-Efficiency and Circularity
The chemical industry plays a pivotal role in facilitating more sustainable and circular production. Enhancing the eco-efficiency of our facilities is a vital component of our sustainability approach. We do this by setting requirements to help foster environmental protection at our sites. At all our sites site management continuously seeks ways to reduce environmental impacts, waste generation, and energy consumption through objective plans with associated annual targets for energy reduction and use of best available technologies.

We have a robust Carbon Business Strategy and roadmap to reduce GHG emissions and see carbon not as a challenge but as a business opportunity. This includes exploring innovative solutions and partnerships to reduce GHG emissions across our value chain.

We report greenhouse gas emissions in CO2 equivalents at three levels: emissions from our own operations (Scope 1), emissions from purchased energy (Scope 2), and emissions across our value chain (Scope 3, both upstream and downstream). We calculate our GHG inventory (Scopes 1 and 2) as well as other energy and environmental metrics on a quarterly basis and report results to our CR Council and CR Board Committee. This allows us to measure progress against our targets. We also developed dashboards with GHG and eco-efficiency data so that each of our sites worldwide can track their performance, using a site-at-a-glance tool. Furthermore, we have developed internal reports and guidance procedures that describe our calculation methodology so we can ensure consistency from year to year.
Looking for tables and graphs of our GHG, Energy Management or other environmental performance?
See our annual sustainability data reporting and sustainability report for details and footnotes.

Life-cycle assessment (LCA)
To assist our customers, we use life-cycle assessments (LCAs) to evaluate and enhance the environmental performance of our products within the value chain. A product carbon footprint (PCF) is one of the many environmental impact categories derived from the LCA. It calculates total GHG emissions – CO2 and other GHG emissions (expressed as CO2 equivalent) – generated by a product throughout its life cycle. PCFs provide our customers with valuable information for assessing GHG emissions and offer transparency regarding the GHG emissions associated with our products.
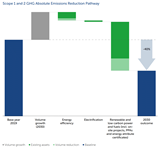
We will reduce emissions through a wide range of actions, with a focus on Carbon Operation Excellence, Energy Efficiency and Innovation, and additionally, Value Chain Collaboration on Scope 3.
In 2020, 56% of our energy came from low-carbon and renewable sources, such as hydro, wind, solar, biomass for power, and steam from bio-waste. This was a slight increase from the year prior. We have set the goal to further increase the share of our purchased low-carbon and renewable energy to more than 60% by 2025.
For example, we source renewable energy using trusted approaches, such as assets owned by Nouryon, Purchase Power Agreements (PPA) with third parties, or energy attribute certificates backed by recognized industry standards and documentation.
To strengthen our sustainable energy sourcing capabilities, in 2020 we established the Nouryon Energy Team (NET). The NET brings together cross-functional expertise in Energy, Procurement, Operations, and Sustainability to further optimize and develop a comprehensive Energy Management Plan of sustainable and low-carbon energy solutions across the company.
In addition to product design, we seek opportunities to reduce waste in our value chain. For instance, at our Asa site in Japan, our customers return empty containers for products, so that these can be reused or recycled. Since
2024 the site has received over 155,000 containers from our customers for reuse or recycling.
We also use the on-site expansion of our Expancel® expandable microsphere product and point-of-use mobile expanders to decrease shipping volumes and costs. Every truckload of material our customers expand on-site saves 30 to 40 truckloads. We constantly seek ways to ship more efficiently to save costs and reduce our environmental impact. This includes utilizing warehouses closer to customers and reusable dunnage, which provides a dual benefit by reducing packaging waste and eliminating the need for special cleaning at customer sites.
Many of our solutions are essential for reducing GHG emissions for our customers. For instance, our Expancel® expandable microspheres can lighten packaging and components of vehicles, which improves transportation fuel
efficiency and reduces transportation-related emissions.
Similarly, we offer solutions that are crucial to renewable energy-related products. These include lightweight composite parts in wind turbines and insulation for high-quality, high-voltage cables, as well as aiding in making solar
panels durable and highly efficient. Another example is our solutions for cool roof coatings. By lowering the need for air conditioning, these coatings help reduce energy costs and GHG emissions.

In support of our Carbon Business Strategy, and with the support of an external consultant agency, we further enhanced our methodology for our Scope 3 emissions inventory covering estimated emissions across the value chain. We reviewed primary and secondary data sources and refined our approach to build more rigor in our calculations and methodology. In general, we strive to utilize data sources that are temporally relevant and geographically representative. Where possible, we prioritized physical quantities (mass of purchased raw materials and generated waste, miles traveled) over spend-based data. Learn more in our Sustainability report how this is calculated.
Considering emissions across the full value chain helps us build a robust climate strategy, provides further insight into potential reduction opportunities and how these compare with Scopes 1 and 2 reductions, and informs our Scope 3 plans including potential partnerships. A Scope 3 analysis relies upon inherent assumptions, and the approaches and tools will advance over time. For example, Category 12 has a range of uncertainty because of different assumptions of product end-of-life treatment. Despite these uncertainties, the analysis provides helpful insight on the relative footprint of different parts of our value chain.
We will continue to refine our Scope 3 calculations and use the results to inform our pathways to achieve our long-term carbon strategy.


